Mine Design Activity
Concept Overview
Mining engineers transform raw exploration data into a three‐dimensional model of an orebody. This model underpins all subsequent engineering decisions: pit design, production scheduling, and economic analysis.
In this station, we’ll load assay data from drill holes into MinePlan3D, build meshes of ore boundaries, and visualize phased open‑pit shells.
Station Setup
- Launch MinePlan3D and set project folder to
ua workshop. - Accept the UA temporary license prompt.
- In the Data Explorer’s “project view,” queue up these folders:
- ms resources
- hw
- pit
- Double‑click each required file to send to “open view”; use the lightbulb icons to toggle visibility.
- Use arrow keys to rotate the 3D view; hold Shift + arrows to pan.
File List
Queue and display the following:
- Coreholes Assay %
- Bottom of Ore Mesh
- Ore Volume (uncropped)
- Ore Grade Finite‐Element Model
- Phase 1 Design & Surface
- Phase 2 Design & Surface

Step 1: Digitized Corehole Data
Open “Coreholes Assay %”:
- Displays measured copper assays at depth, colored by grade.
- Each drill hole shows sample intervals; hover for exact % (in software).
- This is analogous to the hand‑drawn cross‑sections from Exploration, but in full 3D.

Step 2: Creating Meshes
Display “Bottom of Ore Mesh”:
- The mesh connects predicted bottom‐of‐ore points into a continuous surface.
- Similarly generate a “Top of Ore” mesh—together they define the ore–body volume.
- Inspect mesh quality: look for spikes or gaps indicating poor data fit.
Learn About Mine Design
Concept Overview
Mining engineers must turn sparse drill‐hole logs into reliable estimates of ore tonnage and grade. These estimates drive cost–benefit decisions: is the deposit worth mining?
We’ll simulate this by hiding a “Play‑Doh ore” body in kinetic sand, drilling “cores,” logging them, and practicing estimation methods before actually recovering the ore.
Materials
- Graph paper, two colored markers, ruler, calculator
- Gram scale (for weighing recovered ore)
- Kinetic sand (background), Play‑Doh (ore)
- Plastic box (mine property), boba‑straw drills
- Core samples from Exploration Station, worksheets
Station Setup
- Construct the box:
- Layer half the sand, embed an oval of Play‑Doh, cover with remaining sand.
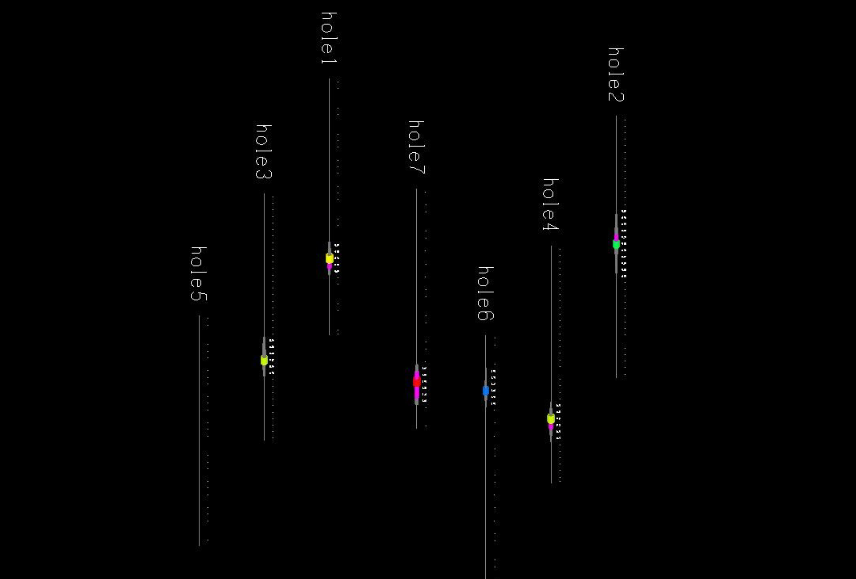
- Use straws to drill 4 holes in a row (east–west), one above (north), one below (south).
- Place each “core” sample at its matching hole location.
- Arrange the gram scale, calculator, graph paper, markers, and the first‑group’s completed worksheet at the front.
- Other groups get blank worksheets and their own mine box from the previous station.

Activity
Students will:
- Log cores: On the worksheet’s core‐log panel, use two colors to draw each layer (e.g., sand vs. Play‑Doh).
- Draw cross‑section: Under plan view, align the four cores horizontally. Connect identical colored layers between cores—if a layer ends between, close the shape to the bottom/top to estimate disappearance.
- Define ore area: On the plan map, draw an envelope (oval/rectangle) enclosing all cores containing Play‑Doh and excluding empty cores.
- Estimate ore volume:
- Method A: Prism approximation between adjacent holes.
- Method B: Average thickness × plan area.
Tip: Discuss which method might over‐estimate or under‐estimate and why. - Calculate mass: Use the measured Play‑Doh density (provided on the worksheet) to convert volume → grams.
- Recover ore: Dig out the Play‑Doh, weigh it on the gram scale, and compare to your estimates.
